Показаны сообщения с ярлыком fxtrade. Показать все сообщения

среда, 4 июля 2012 г.

OANDA will suspend weekend market

OANDA Corporation  OANDA will suspend weekend market to bring
  trading hours in line with industry standards


Dear Client,

OANDA Corporation will adjust its operating policy indefinitely to bring trading hours in line with industry standards. Beginning this Friday, July 6, 2012, our weekly trading session will close on Friday afternoons at 4:00 PM EDT and reopen Sunday afternoons at approximately 3:00 PM EDT.

OANDA was the sole forex provider to offer weekend trading, and did so as a client service despite the fact that global forex markets do not operate on Saturdays and Sundays. Regular weekday trading will not be impacted by this alteration to OANDA's operating hours.

"Maintaining a market when the international currency markets are closed represents a significant challenge," noted OANDA's Chief Technology Officer, Tony Savor. "In the absence of live market data, OANDA could still offer a price for each currency pair, but with no active market in which to hedge customer trades, OANDA was forced to take on greater risk. To mitigate this risk, it was necessary to increase spreads but this was deemed to be at odds with OANDA's objective of keeping client costs as low as possible. Our commitment to providing low spreads was a major consideration in this decision."

"We understand that for some, this change in trading hours will be an inconvenience," said OANDA CEO K Duker, "but when we compare the risk weekend trading represents with the very low volumes actually traded, the obvious conclusion is to suspend trading during non-market hours. This will also enable OANDA to concentrate additional resources on accommodating the needs of our clients during regular market hours, when the vast majority of our clients depend on OANDA to provide a fair and efficient market in which to trade."

We appreciate your business. Please contact OANDA customer service with any questions you may have.

Sincerely,
OANDA

пятница, 1 апреля 2011 г.

OANDA: A Brief History

OANDA was founded on the belief that technology and the Internet would globalize the marketplace, creating an unprecedented need for currency-related products and services. Today, the global forex market trades over $3 trillion/day (30 times larger than NASDAQ and NYSE combined), with online retail trading a rapidly growing part of that market. We estimate that over 20% of the world's online spot forex transactions take place on OANDA's servers.
Possessing one of the world's largest and most accurate databases of currency rates, OANDA was the first in 1995 to offer a broad range of currency exchange-rate information free of charge over the Web. Today, it handles more than a million queries a day. In 1997 OANDA became an Internet-based business-to-business application service provider (ASP) and currently services over 75,000 ASP clients around the world.

With its launch of fxTrade in 2001, OANDA was one of the first companies to offer fully automated online currency trading. The OANDA fxTrade system provides retail and institutional clients a state-of-the-art platform that enables competitive, real-time access to the foreign exchange market.

In 2008 OANDA used the same rationale to launch a fully automated, online funds transfer service, fxGlobalTransfer. With its 24/7 availability, low, variable spreads, price transparency, and security, this OANDA innovation was designed to offer clients a low-cost, convenient, and secure method of sending funds globally at any time from any computer connected to the Internet.

OANDA was co-founded by Dr. Michael Stumm, a professor of Computer Engineering at the University of Toronto, and Dr. Richard Olsen of The Olsen Ltd., a leading econometric research and development firm. The company was incorporated in the state of Delaware in 1996.

понедельник, 2 августа 2010 г.

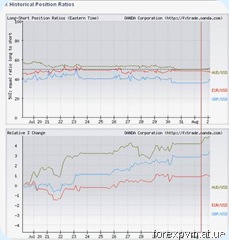
OANDA: FX Historical Position Ratios

  Адрес этой страницы на сайте OANDA:

http://fxtradeinfocenter.oanda.com/orderbook/historical_positions

  Перевести название можно как “Исторические соотношения открытых позиций на FOREX”

  На данной странице представлены графики этих самых соотношений в процентах.

FX Historical Position Ratios_400 Как читать графики:

  You can select/unselect any of the above currency pairs. You can also click on the graph area to activate a vertical guide line.

  For each currency pair, the top graph shows the ratio of long positions to overall positions over time. When the ratio passes the 50% line then there are more long positions than short positions, and when the ratio falls below 50% then there are more short positions than long positions. For example, a ratio of 80% for EUR/USD means that 80% of EUR/USD positions are long and 20% are short.

  The bottom graph shows price movements of a currency pair over time. The percentage of change is relative to the price at the beginning/ending of time period.

На русском языке это выглядит так:

  На графиках Вы можете выбрать любые из доступных под ними валютных пар. Вы также можете кликнуть на графике, чтобы активировать вертикальную линию.

  Для каждой валютной пары, верхний график показывает соотношение длинных позиций к общей(суммарной) позиции с течением времени. Когда соотношение выше линии 50%, это означает, что преобладают длинные позиции, и наоборот, когда соотношение падает ниже линии 50%, то преобладают короткие позиции. Например, соотношение 80% для EUR/USD означает, что 80% всех позиции по EUR/USD – длинные, и только 20% - короткие.

  Нижний график показывает динамику изменения котировок с течением времени. Можно выбрать, относительно чего отображать процент изменения - по сравнению с ценами на начало или окончание периода времени.

  Я провел небольшое исследование на тему – а что же тут показано? Больше всего интересовал меня второй граф - динамика изменения котировок с течением времени.

  Для графика из этого примера, я рассчитал процент изменения цены на 31.07.2010 относительно 19.07.2010, для различных вариантов расчета цены (т.к. на графике линия стоит около 0.9%, а простые цены дневного бара 19.07.2010 не дают такой величины):

19 1%% 31
jul jul price change %% change
O 1,29028 0,01290 1,30506 0,01478 1,14549
H 1,29922 0,01299 1,30506 0,00584 0,44950
L 1,28707 0,01287 1,30506 0,01799 1,39775
C 1,29626 0,01296 1,30506 0,00880 0,67888
(O+H+L)/3 1,29219 0,01292 1,30506 0,01287 0,99598
(O+H+L+C)/4 1,29321 0,01293 1,30506 0,01185 0,91652
(H+L)/2 1,29315 0,01293 1,30506 0,01192 0,92140
(O+C)/2 1,29327 0,01293 1,30506 0,01179 0,91164

   Наиболее похожим на правду мне кажется вариант расчета по (O+C)/2. Так что, я пока верю этому графику, т.к. он стал мне понятен. Хотя над практическим применением надо еще думать.